

SenseML to spreadsheet reference
Introduction
If you're trying to convert a document, such as a PDF, into an Excel file, you often encounter tools that copy the document's visual layout into a spreadsheet, with no meaningful relationship between the extracted text and the underlying cells.
In contrast, Sensible converts document tables, checkboxes, paragraphs, and even complex repeating section layouts into meaningfully labeled column/row pairs and linked sheets. For information about document file types that Sensible can extract data from, see Supported file types.
This topic describes the rules Sensible uses to:
-
convert data extracted from one document, such as a PDF, into an Excel spreadsheet or CSV file.
-
combine data extracted from multiple documents into one spreadsheet
Sensible extracts the data as JSON using a SenseML configuration, then applies the rules to create spreadsheet data such as tables, labeled columns, and linked sheets.
Prerequisites
To get a document's data into a spreadsheet, you must first:
-
Configure extractions for a document type, either by authoring an extraction configuration using the Sensible app, or by using Sensible's configuration library for common document types.
-
Run an extraction on a target document that's in your configured document type.
CSV files
To generate CSV files, Sensible uses the same rules described in the following sections, except that Sensible uses blank rows instead of tabbed sheets to separate extraction content.
Multi-document spreadsheet
Sensible combines multiple document extractions into one spreadsheet when:
- You extract from a portfolio document.
- You input multiple extractions to the Generate Excel method or endpoint, or select multiple documents and click Download Excel in the Sensible app. Note you can combine portfolio and single-document extractions.
To combine extractions, Sensible uses the same rules described in the following single-document spreadsheet rules. Sensible uses the following additional rules:
-
For all sheets other than the
<fields>sheet, Sensible creates a new sheet for each document, and prefixes each sheet name with a zero-indexed document number, for exampledoc_0ordoc_1. -
For the
<fields>sheet, Sensible appends data for each document in a new row. For each field ID, Sensible appends data under the same column if it finds a matching field ID from another extraction in your call to the Generate Excel method or endpoint, or under a new column if it doesn't find an matching field ID. -
For portfolio extractions, Sensible adds metadata to the
<fields>sheet, for example, the page range of the document in the portfolio. As an example, for documentsany_single_account_bank_statement_sample.pdfandportfolio_bank_paystub_tax.pdf, Sensible outputs the following:
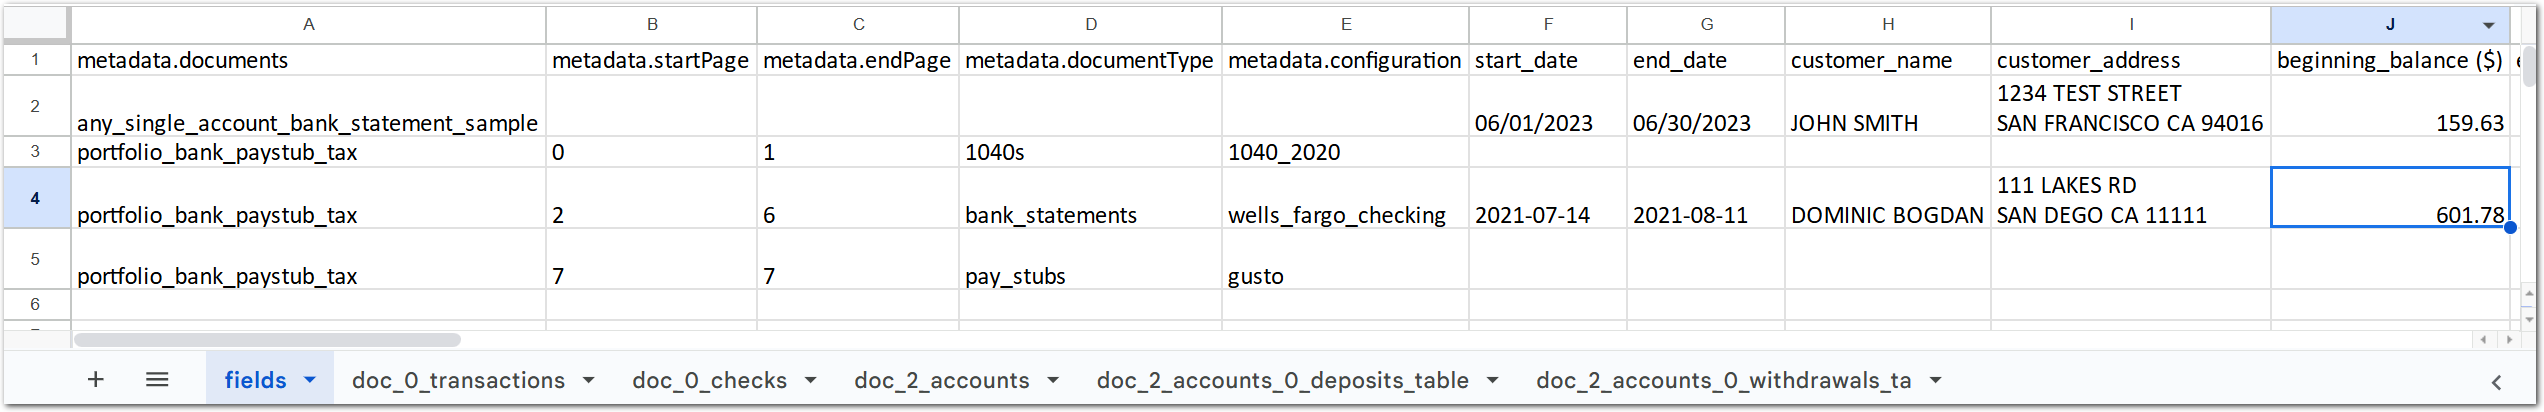
Where doc_0 refers to any_single_account_bank_statement_sample.pdf, and doc_2 refers to the bank statement document in page range 2-6 of portfolio_bank_paystub_tax.pdf.
Tips
- To avoid manually merging the similarly named columns, Sensible recommends using the same IDs for corresponding fields across different SenseML configs in a document type. For example, if document A outputs fields
car_modelandcar_year, and document B outputscar_modelandmanufacture_year, Sensible creates a spreadsheet like the following:
In the preceding example, Sensible recommends using either car_year or manufacture_year, not both.
- To configure multi-document spreadsheet output using different rules than those described here, configure rules with Sensible's Zapier integration. You can map single-value field output with this integration, but not multi-value field output.
Single-document spreadsheet
Overview
Sensible transforms JSON data extracted from a single document to a spreadsheet using the following rules:
- the
fieldssheet lists each piece of document data that can be represented as a single-cell value. For example, an extracted total monthly mortgage dollar amount. <field_id>sheets hold more complex pieces of document data. For example, an extracted table.<field_id>.<index>sheets hold complex repeating document data. For example, an extracted claims loss run.
For more information, see the following sections.
fields sheet
fields sheetThe fields sheet lists fields and their values as key-value dictionaries, with the field ID as the column heading and value as the row. Sensible outputs a field to this sheet if the field:
-
outputs a single
value. For example, the Box, Label, Row and Region methods each output a single value by default. -
outputs a predictably short array of values that can easily be stringified in a single cell. Typically this is the result of a Type configuration, for example, the Name type always outputs an array.
Example
Sensible converts the JSON extraction output from the auto_insurance_anyco example described in the Getting started with layout-based extractions to the following spreadsheet:
Spreadsheet output
Example document
The preceding spreadsheet contains data from the following example document:
| Example document | Download link |
|---|
Example configuration
See the Getting started with layout-based extractions for the SenseML configuration for this example.
JSON output
The following JSON document extraction output is the source for this spreadsheet:
{
  "policy_period": {
    "type": "string",
    "value": "April 14, 2021 - Oct 14, 2021"
  },
  "comprehensive_premium": {
    "source": "$150",
    "value": 150,
    "unit": "$",
    "type": "currency"
  },
  "property_liability_premium": {
    "source": "$10",
    "value": 10,
    "unit": "$",
    "type": "currency"
  },
  "policy_number": {
    "value": "123456789",
    "type": "string"
  }
}
<field_id> sheets
<field_id> sheetsEach <field_id> sheet lists the output of a single field. Sensible outputs a field to this sheet if the field outputs multiple values. For example:
- the table methods and other methods that output nested JSON objects.
- methods that output arrays of unpredictable length, for example, fields with
"match":"all"configured.
Example
Sensible converts the example JSON output from the example document described in the Fixed Table method to the following spreadsheet:
The preceding example shows that the fields sheet lists the corresponding sheets for fields that have complex output. In this case, you must click on the agile_risks_table_updates_monthly sheet to view the table output.
Example document
The preceding spreadsheet contains data from the following example document:
| Example document | Download link |
|---|
Example configuration
See Fixed Table method for the SenseML configuration for this example.
JSON output
The following JSON extraction output is the source for this spreadsheet:
{
  "agile_risks_table": {
    "columns": [
      {
        "id": "col1_risk_description",
        "values": [
          {
            "value": "Poor task point estimation",
            "type": "string"
          },
          {
            "value": "Poor epic scope definition",
            "type": "string"
          },
          {
            "value": "Inadequate scrum master training",
            "type": "string"
          }
        ]
      },
      {
        "id": "col4_rank_last_month",
        "values": [
          {
            "source": "2",
            "value": 2,
            "type": "number"
          },
          {
            "source": "1",
            "value": 1,
            "type": "number"
          },
          {
            "source": "3",
            "value": 3,
            "type": "number"
          }
        ]
      }
    ]
  }
}
<field_id>.<index> sheets
<field_id>.<index> sheetsEach <field_id>.<index> sheet lists the output of a single field that contains complex repeating data, for example, Sections output.
Example
Sensible converts the example JSON output from the example document described in the Advanced Sections nested table example topic to the following spreadsheet:
The preceding example shows that Sensible outputs nested sections in linked, indexed sheets.
Example document
The preceding spreadsheet contains data from the following example document:
| Example document | Download link |
|---|
Example configuration
See the Advanced sections nested table example topic for the SenseML configuration for this example.
JSON output
The following JSON extraction output is the source for this spreadsheet:
{
  "table_columns": [
    {
      "employee_category": {
        "type": "string",
        "value": "Employees paid \u0000100k"
      },
      "employee_benefit": {
        "value": "100% of salary, max $100k",
        "type": "string"
      },
      "reduction_subtable": {
        "columns": [
          {
            "id": "col1_age",
            "values": [
              {
                "source": "65",
                "value": 65,
                "type": "number"
              },
              {
                "source": "70",
                "value": 70,
                "type": "number"
              },
              {
                "source": "75",
                "value": 75,
                "type": "number"
              }
            ]
          },
          {
            "id": "col2_reduction",
            "values": [
              {
                "source": "35%",
                "value": 35,
                "type": "percentage"
              },
              {
                "source": "60%",
                "value": 60,
                "type": "percentage"
              },
              {
                "source": "75%",
                "value": 75,
                "type": "percentage"
              }
            ]
          }
        ]
      },
      "everything_in_this_vertical_section": {
        "type": "string",
        "value": "Employees paid \u0000100k  Notes Employee benefit 100% of salary, max $100k  After a 3 month waiting period Common carrier Not included  Benefit reduction Age Reduction   Not adjusted for 65 35%   inflation 70 60%   75 75%   For more details about coverage and benefits, see the following sections."
      }
    },
    {
      "employee_category": {
        "type": "string",
        "value": "All other employees"
      },
      "employee_benefit": {
        "value": "50% of salary, max $50k",
        "type": "string"
      },
      "reduction_subtable": {
        "columns": [
          {
            "id": "col1_age",
            "values": [
              {
                "source": "65",
                "value": 65,
                "type": "number"
              },
              {
                "source": "70",
                "value": 70,
                "type": "number"
              },
              {
                "source": "75",
                "value": 75,
                "type": "number"
              }
            ]
          },
          {
            "id": "col2_reduction",
            "values": [
              {
                "source": "35%",
                "value": 35,
                "type": "percentage"
              },
              {
                "source": "60%",
                "value": 60,
                "type": "percentage"
              },
              {
                "source": "75%",
                "value": 75,
                "type": "percentage"
              }
            ]
          }
        ]
      },
      "everything_in_this_vertical_section": {
        "type": "string",
        "value": "All other employees Notes Employee benefit  50% of salary, max $50k After a 3 month waiting period Common carrier  Not included Benefit reduction   Age Reduction Not adjusted for   65 35% inflation   70 60%   75 75% For more details about coverage and benefits, see the following sections."
      }
    }
  ]
}
Next
- For a tutorial about converting document data to an Excel file using the Sensible app, see Getting started with out-of-the-box extraction.
- To get started with extracting from your custom documents, see Getting Started.
Updated 1 day ago